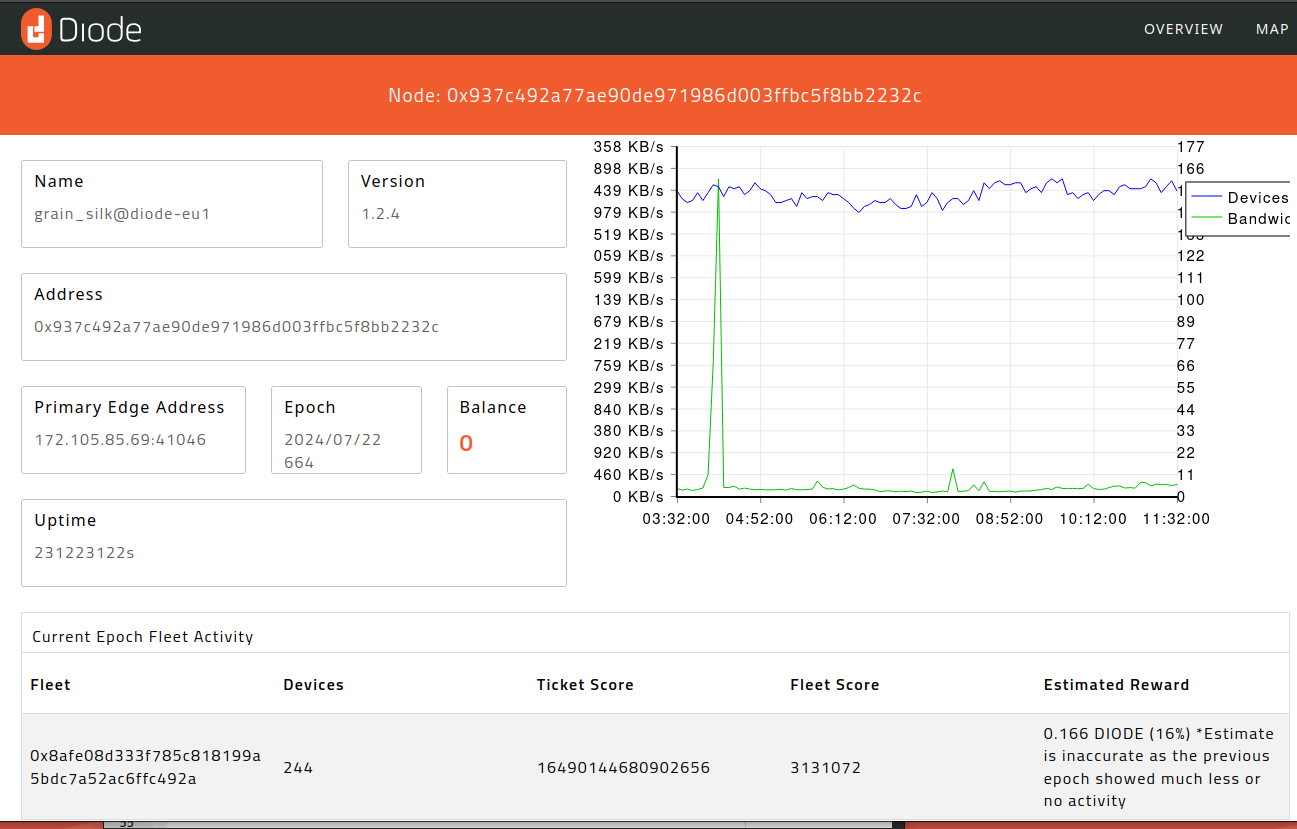
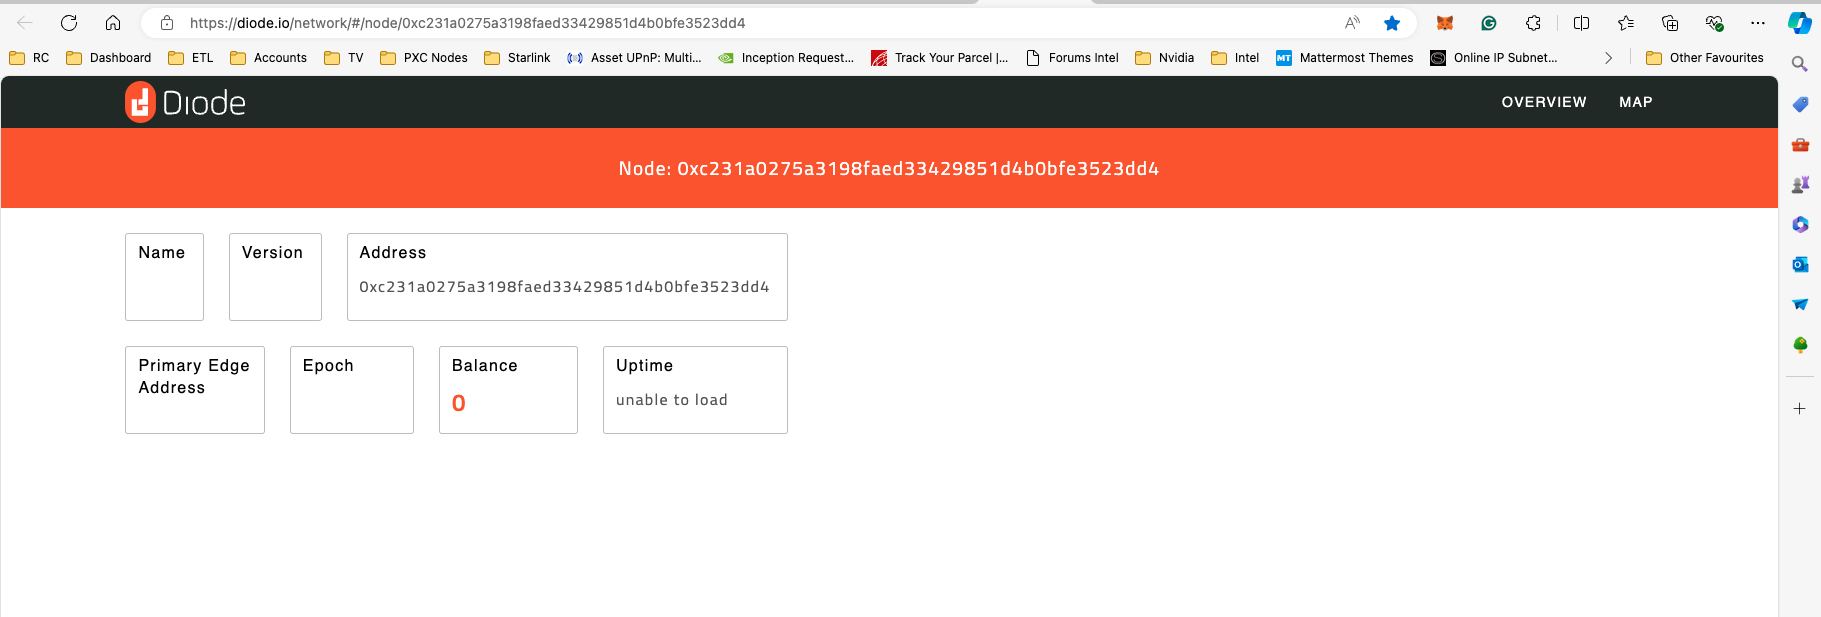
Opening the Dashboard
After installing the lite node the public dashboard can be accessed if the note has been able to connect to the rest of the network and vice-versa.
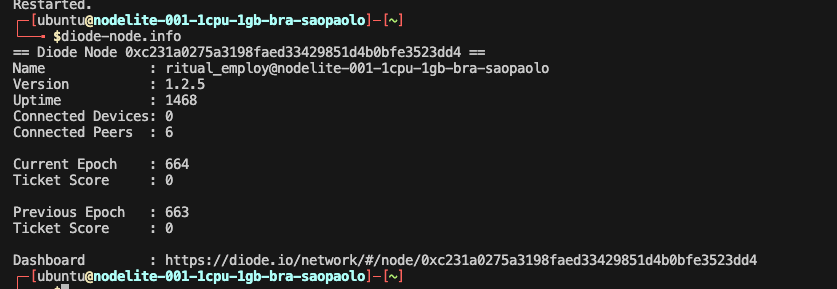
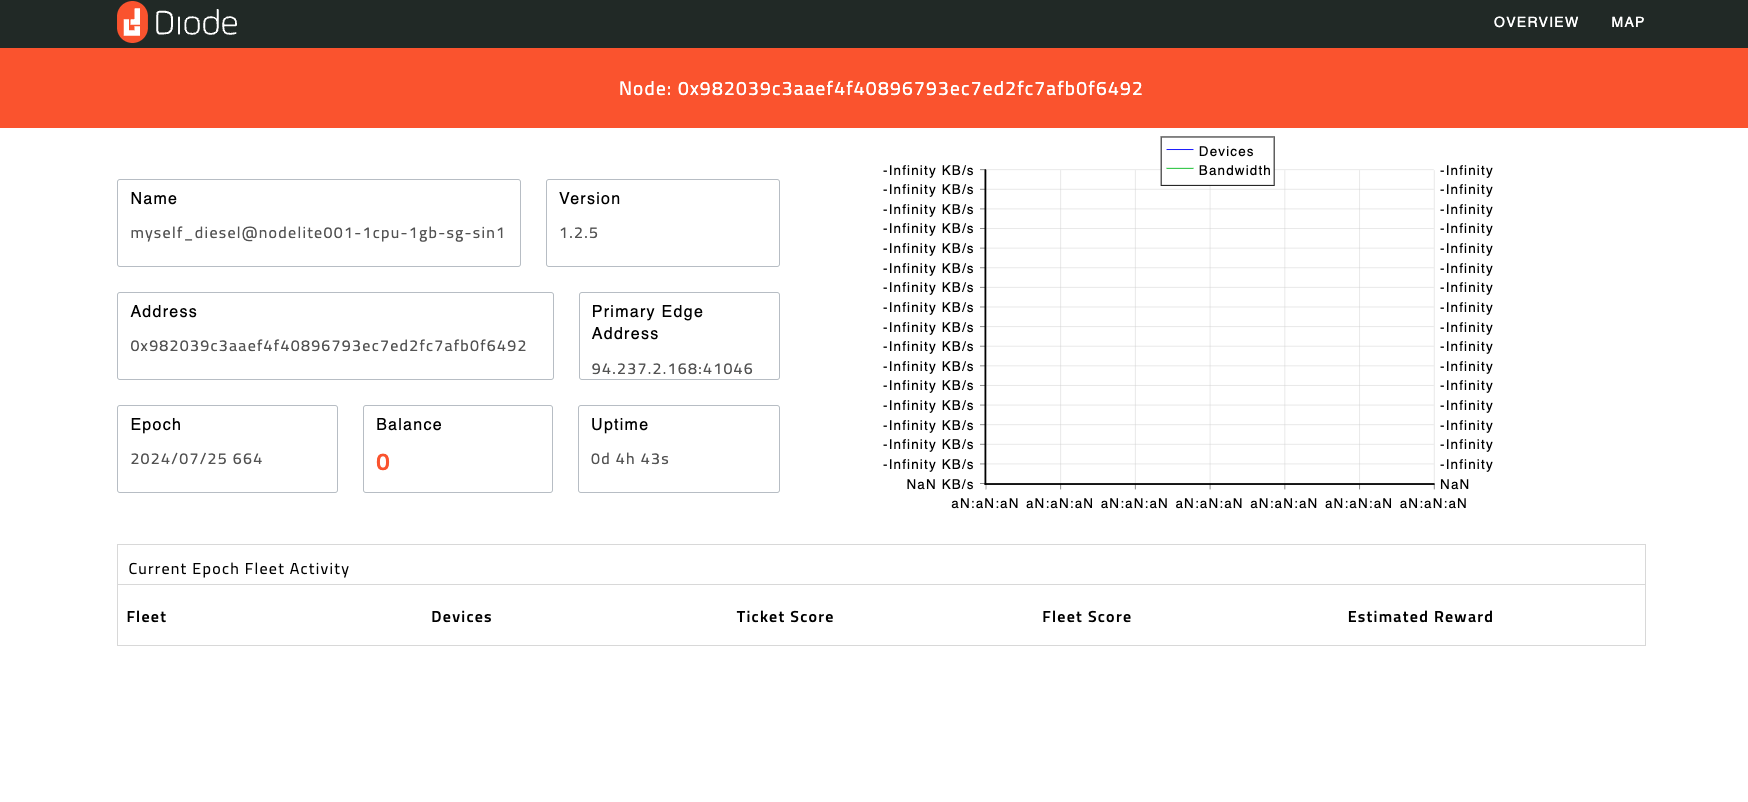
To see the dashboard url run diode-node.info on your node which should provide output like this:
:~# diode-node.info
== Diode Node 0x090ad02cebd8fbbe0b411f5d870ab69d1004d6d8 ==
Name             : swallow_battle@localhost
Version          : 1.2.5
Uptime           : 1357
Connected Devices: 0
Connected Peers  : 6

Current Epoch    : 664
Ticket Score     : 0

Previous Epoch   : 663
Ticket Score     : 0

Dashboard        : https://diode.io/network/#/node/0x090ad02cebd8fbbe0b411f5d870ab69d1004d6d8
Then follow the that dashboard URL. In the example above: https://diode.io/network/#/node/0x090ad02cebd8fbbe0b411f5d870ab69d1004d6d8